


Introduction
In these last years the development of open source software and the release of open data by public, private and nonprofit companies have opened the possibilities to do new quantitative techno-social studies. Moreover new platforms make easy to share it through social platforms with intuitive interfaces. This implies that it is possible to reach a vast potential audience with potential great impact on the society. The principal goal of the studies about urban mobility is to optimize people displacements in cities. The possibilities to inform citizen about scientific result is the key to rise the awareness of the public opinion about mobility habit in order to real observe behaviour changes.
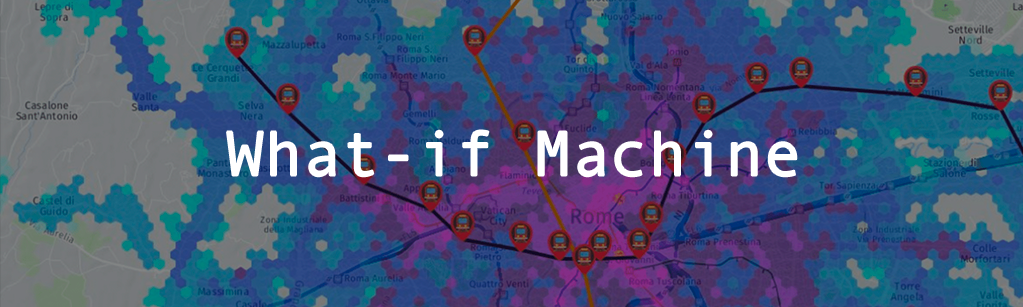
In this post we show the isochrones of several cities. The isochrone is the set of points that can be reached, in an interval of time, from a starting point. We consider here the isochrones generated by public transport displacements in urban context.
Try It Now! Search your home, work or preferite places:
citychrone web-site
This study can be accomplished thanks to the following data and software.
Data and software used
A large number of public local transport agencies has released their data about public transportation schedules. They are induced by google that defined the standard file format GTFS for public transportation schedules. These data, automatically, can be processed and integrated in routing platform like google map.
Another open data used in this study is supported by a non-profit organizations and it contains crowdsourced data. I’m talking about OpenStreetMap the biggest free editable map created by the users and today is the principal open and free alternative to the proprietary google map.
These big new data need new tools that allow to properly analyze them, so new open software libraries have been developed. One of most promising seems to be OpenTripPlanner (OTP). OTP is a java library for multimodal trip planning & analysis. It was seeded by Portland, Oregon’s transit agency TriMet.
In summer of 2013, the OTP project was accepted for membership in the Software Freedom Conservancy (SFC).
The third step of this analysis concerns to construct easily and intuitive interface to show the results. The web page offers incredible elements of interactions and graphics for presenting scientific results. In this context the principal role is played by JavaScript libraries. In this study we used the open source platform Bootstrap to build the site interactions and the open source library leaflet to create interactive maps.
Some preliminary results:
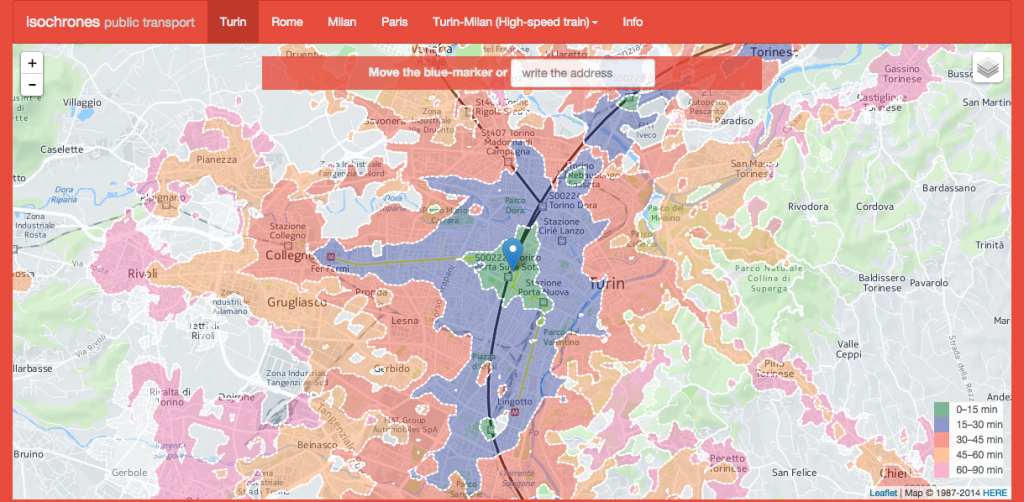
Here I show you the isochrones for different time intervals considering public transport displacements.
First of all we notice the contours of public transport isochrones are strongly influenced by subways lines. Along these lines the isochrones widen, widening the reachable zones in the time interval considered. This effect is easily visible observing the isochrones of Rome: we see clearly a X contour that start from Termini train station, due to the presence of only two lines of subways.
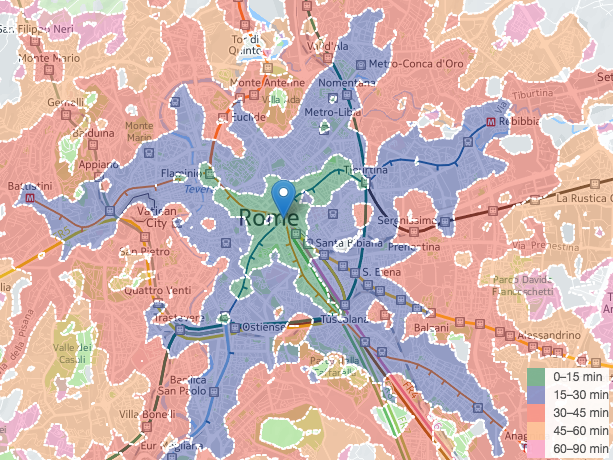
Rome isochrone maps.
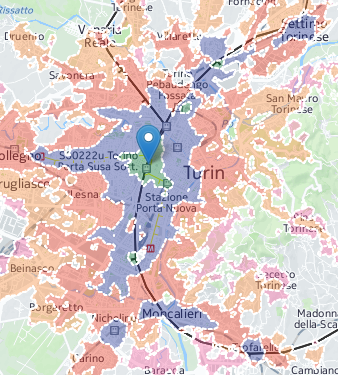
Also the urban railways strongly influence the isochrones: we observe small islands very far from the starting point, that are reachable in small time. This effect is clearly visible in Turin where small district in his metropolitan region in the north (Settimo, Volpiano) as well as in the south (Nichelino, Moncalieri) are easily reachable.
The situations in Paris is different. The high number of subways makes the isochrone contours more complex.
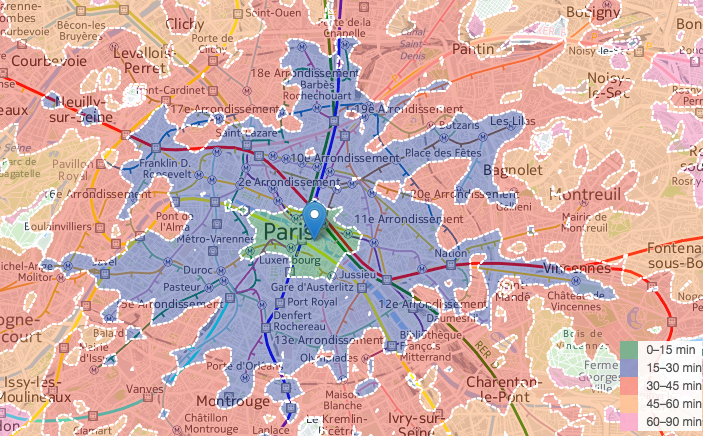
Paris isochrone map.
Future development:
The study considered here represent one standard computations called one-to-many, meaning that we consider one starting point and computed some quantity related to all other point in the graph that represent the street network. In simply terms with these studies we see the properties of one point of the maps related to all other points.
Interesting and also more demanding are the many-to-many computations, where, in one map, it is possible to show global properties of the city. One example is described here. Possible future work will be related to this kind of computations, with the aims to give a global pictures of the city, making also possible quantitative comparison between cities.
acknowledge
This study is developed at ISI. This study is part of Elise Project.
![]()

Progetto finanziato nell’ambito del POR FESR 2007/2013 della Regione Piemonte con il concorso di risorse comunitarie del FESR, dello Stato Italiano e della Regione Piemonte

Pingback: ISI Foundation – ISI Foundation presents CityChrone, a Public Transport Isochrone Map