


Categories are fundamental to recognize, differentiate and understand the environment. From Aristotle onwards, the issue of categorization has been subject to strong controversy in which purely cultural negotiation mechanisms competed with physiological and cognitive features of the categorizing subjects.
The computational model used for this study, investigates how a population of individuals can develop a shared repertoire of linguistic categories, i.e., co-evolve their own system of symbols and meanings, without any pre-defined categorization and by only means of elementary language games (read more). A population of N artificial agents is considered and to each agent (or individual) a continuous perceptual space (e.g., the visible light spectrum) is associated which, without any loss of generality, is assumed to be the interval [0, 1). A categorization pattern refers to a partition of this interval into sub-intervals, or perceptual categories. Each individual has a dynamical form-meaning repertoire linking perceptual categories (meanings) to words (forms) representing their linguistic counterpart. The perceptual categories and the words associated with them co-evolve through a sequence of elementary language games among the agents. Initially, all individuals have a single perceptual category [0, 1) and no name associated to it. At each time step a pair of individuals (one will be denoted as the speaker and the other as the hearer) is randomly selected from the population and based on the success or failure of communication, both rearrange their form-meaning inventories. Both the speaker and the hearer are presented with a scene made of M ≥ 2 stimuli (objects), where a stimulus is a real number in the interval [0, 1). Without any loss of generality we will use in all the simulations M = 2. Any two objects in the scene cannot appear at a distance closer than dmin: this is the only parameter of the model, fixing a minimal length scale which encodes a non infinite resolving power of any perception, for instance, the human Just Noticeable Difference in the case of colors. One of the objects is randomly selected to be the topic of the game and is known only to the speaker. The speaker checks whether the topic is the unique stimulus corresponding to one of its perceptual categories. If the two stimuli fall in one perceptual category, then the category is divided into two new categories by a barrier located in the center of the segment connecting the two stimuli. Both the new categories inherit the words associated to the original category plus a new word; this process is termed as discrimination. Subsequently, the speaker utters the most relevant name of the category containing the topic, where the most relevant name corresponds to either the last name used in a winning game or the new name in case the category has just been created. If the hearer does not have a category with this name, the game is a failure. If the hearer recognizes the name and has any object in one or more categories associated with that name, then it picks randomly one of these objects. If the object picked is the topic, then the game is a success; otherwise, it is a failure.
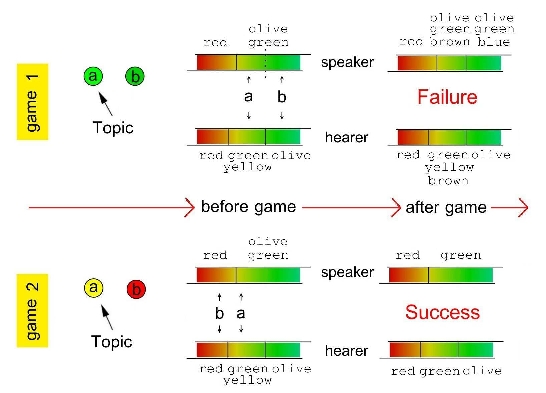
In case of failure, the hearer learns the name used by the speaker for the category corresponding to the topic. In case of success, that name becomes the most relevant for that category and all other competing names are removed from the inventory associated with the category for both the players. An example game is presented in Figure 1.
Figure 1. Rules of the category game. A pair of examples representing a failure (game1) and a success (game 2), respectively. In a game, two players are randomly selected from the population. Two objects are presented to both players. The speaker selects the topic. In game 1 the speaker has to discriminate the chosen topic (“a” in this case) by creating a new boundary in his rightmost perceptual category at the position (a + b)/2. The two new categories inherit the words-inventory of the parent perceptual category (here the words “green” and “olive”) along with a different brand new word each (“brown” and “blue”). Then the speaker browses the list of words associated to the perceptual category containing the topic. There are two possibilities: if a previous successful communication has occurred with this category, the last winning word is chosen; otherwise the last created word is selected. In the present example the speaker chooses the word “brown”, and transmits it to the hearer. The outcome of the game is a failure since the hearer does not have the word “brown” in his inventory. The speaker unveils the topic, in a non-linguistic way (e.g. pointing at it), and the hearer adds the new word to the word inventory of the corresponding category. In game 2 the speaker chooses the topic ”a”, finds the topic already discriminated and verbalizes it using the word ”green” (which, for example, may be the winning word in the last successful communication concerning that category). The hearer knows this word and therefore points correctly to the topic. This is a successful game: both the speaker and the hearer eliminate all competing words for the perceptual category containing the topic, leaving “green” only. In general when ambiguities are present (e.g. the hearer finds the verbalized word associated to more than one category containing an object), these are solved making an unbiased random choice.
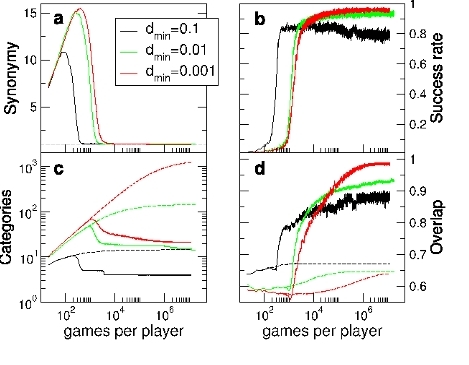
The main results from the category game are summarized in Figure 2. At the beginning all individuals have only the perceptual category [0, 1) with no associated name. During a first phase of the evolution, the pressure of discrimination makes the number of perceptual categories increase, see dashed lines in Figure 2(c): at the same time, many different words are used by different agents for some similar categories. This kind of synonymy reaches a peak and then dries out (as displayed in Figure 2(a)), in a similar way as in the Naming Game described before: when on average only one word is recognized by the whole population for each perceptual category, a second phase of the evolution intervenes. During this phase, words expand their dominion across adjacent perceptual categories, joining these categories to form new “linguistic categories”. This is revealed by counting the number of these linguistic categories (solid lines in Figure 2(c)), which decreases after some time. The coarsening of these categories becomes slower and slower, with a dynamical arrest analogous to the physical process in which supercooled liquids approach the glass transition. In this long-lived almost stable phase, usually after 10 000 games per player, the linguistic categorization pattern has a degree of sharing between 90% and 100%; success is measured by counting in a small time window the rate of successful games (Figure 2(b)), while the degree of sharing of categories is measured by an overlap function, which measures the alignment of category boundaries (both for perceptual or linguistic ones), and is displayed in Figure 2(d). The success rate and the overlap both remains stable for 10 0000 ∼ 10 00000 games per player: we consider this pattern as the “final categorization pattern” generated by the model, which is most relevant for comparison with human color categories.
Figure 2. Results of simulations of the Category Game model with N = 100 and different values of dmin : a) Synonymy, i.e., average number of words per category; b) Success rate measured as the fraction of successful games in a sliding time windows games long; c) Average number of perceptual (dashed lines) and linguistic (solid lines) categories per individual; d) Averaged overlap, i.e., alignment among players, for perceptual (dashed curves) and linguistic (solid curves) categories.
Numerical World Color Survey
P. Kay and B. Berlin ran a first survey on 20 languages in 1969. From 1976 to 1980, the enlarged World Color Survey was conducted by the same researchers along with W. Merrifield and the data are public since 2003 on the website http://www.icsi.berkeley.edu/wcs. These data concern the basic color categories in 110 languages without written forms and spoken in small-scale, non-industrialized societies. On average, 24 native speakers of each language were interviewed. Each informant had to name each of 330 color chips produced by the Munsell Color Company that represent 40 gradations of hue and maximal saturation, plus 10 neutral color chips (black-gray-white) at 10 levels of value. The chips were presented in a predefined, fixed random order, to the informant who had to tag each of them with a “basic color term” is her language (in English, basic color terms would correspond to these would be “yellow”,“green”, “red”, etc.).
Kay and Regier later performed a quantitative statistical analysis proving that the color naming systems obtained in different cultures and language are in fact not random. Through a suitable transformation they identified the most representative chip for each color name in each language and projected it into a suitable metric color space (namely, the CIEL*a*b color space). They further investigated whether these points are more clustered across languages than would be expected by chance by defining a suitable dispersion measure.
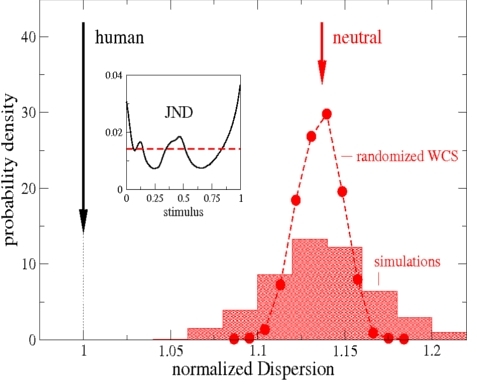
The key aspect of the statistical analysis described above is the comparison of the clustering properties of a set of true human languages against the ones exhibited by a certain number of randomized sets. In replicating the experiment it is therefore necessary to obtain two sets of synthetic data, one of which must have some human ingredient in its generation. The idea that we put forth is to act on the dmin parameter of the Category Game, describing, the discrimination power of the individuals to stimuli of a given wave-length. In fact, it turns out that human beings are endowed with a dmin, the “Just Noticeable difference” or JND, that is not continuous, but rather is a function of the frequency of the incident light (see the inset in Figure 3). Technically, psycho-physiologists define the JND as a function of wavelength to describe the minimum distance at which two stimuli from the same scene can be discriminated. The equivalence with the dmin parameter is therefore clear and different artificial sets can be created:
(i) “Human” categorization patterns are obtained from populations whose individuals are endowed with the rescaled human JND);
(ii) Neutral categorization patterns are obtained from populations in which the individuals have constant JND i.e., dmin = 0.0143, which is the average value of the human JND (as it is projected on the [0, 1) interval, Figure 3(inset)).
Figure 3 illustrates the main results. The Category Game Model informed with the human JND curve produces a class of “worlds” that has a dispersion lower than and well distinct from that of the class of “worlds” endowed with a non-human, uniform JND (i.e., dmin = 0.0143). Strikingly, moreover, the ratio observed in the NWCS between the average dispersion of the “neutral worlds” and the average dispersion of the “human worlds” is Dneutral/Dhuman ∼ 1.14, very similar to the one observed between the randomized datasets and the original experimental dataset in the WCS.
Figure 3. “Neutral worlds”, Dneutral, (histogram) are significantly more dispersed than “human worlds”, Dhuman, (black arrow), as also observed in the WCS data (the filled circles and the black arrow). The abscissa is rescaled so that the human D (WCS) and the average “human worlds” D both equal 1. The histogram has been generated from 1500 neutral worlds, each made of 50 populations of 50 individuals, and M = 2 objects per scene. Categorization patterns have been considered after the population had evolved for a time of106 games per agents. The inset figure is the human JND function. On the vertical axis: the probability density ρ(xi) equals the percentage f(xi) of the observed measure in a given range [xi − ∆/2, xi + ∆/2] centering around xi , divided by the width of the bin ∆, i.e., ρ(xi) = f(xi)/∆. This procedure allows for a comparison between the histogram coming from the NWCS and that obtained in the study on the WCS, where the bins have a different width.
Glassy Dynamics of the Category Game
A detailed analysis of the CG dynamics reveals that the physics of glassy systems can be the proper framework to formalize the intuition that languages change at the same time because of and notwithstanding the fact that they are the outcome of a collective behavior. Languages are described as metastable states of global agreement, reconciling the evidence that they do continuously evolve and they are at the same time stable enough to be intelligible across a population.
The physics of a so-called glass-forming liquid is such that when rapidly undercooled under its melting temperature, it looses it ability to flow on experimental time-scales and freezes in an amorphous state with huge rheological times, while the most stable state – the crystal – is never reached. This slowing down process can be quantified through the so-called relaxation time which turns out to be proportional to the viscosity of the fluid. Despite languages and glassy systems stand apparently very far apart, it is very intriguing to explore the analogy between a linguistic system and a dynamical system featuring glassy properties.
Within this perspective, we study the dynamics of the CG model with the tools of glass theory. In particular, we focus on the main aspects which are peculiar to these physical systems, i.e., the scaling of relaxation times and correlation functions with the population size as well as with the age of the system. In particular, the larger is the time over which one observes the system, formally known as the waiting time, the slower will be its response, i.e., its ability to undergo large-scale changes. From this perspective, the Category Game exhibits a glassy behavior and constitutes a first quantitative evidence of a very interesting link between cognitive science and the physics of glassy systems.
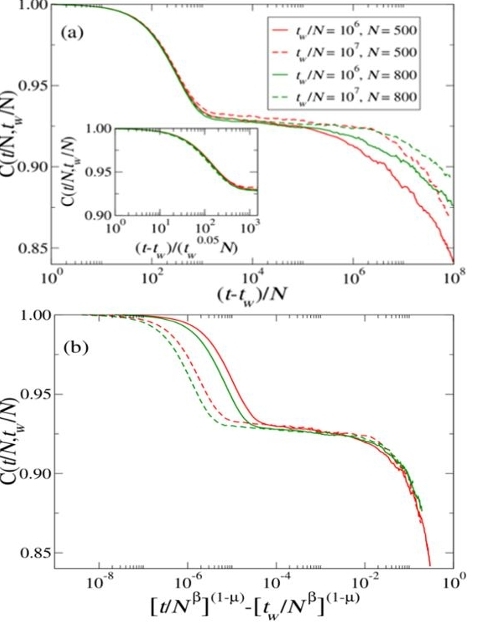
A system is said to be in dynamical equilibrium when it shows invariance under time translations; if this holds, any observable comparing the system at time tw with the system at time tw+t does not depend on tw. In contrast, a system undergoing aging is not invariant under time translation, i.e., time is not homogeneous.
This property can be revealed by measuring correlations of the system at different times. Here we consider a suitably defined autocorrelation function, which we term C(t,tw): at time tw we save a copy of the configuration of all the agents in the population and subsequently, at time instances greater than tw, we compute the alignment of the linguistic category boundaries of each agent with its copy saved at tw; finally, we average this quantity over all agents. Results are presented in Figure 4 for two different population sizes. We recognize two different timescales, which we can associate to local or individual (fast) and collective or population-related (slow) dynamics. In particular, for (t-tw)/N<10000, C(t,tw) depends (almost) only on t–tw (see inset of Figure 4(a)). This phenomenon corresponds to what is known in the physics of glassy systems as the β-relaxation regime. This fast dynamics corresponds to the microscopic dynamics of the boundaries between linguistic categories at the individual level.
On the other hand, for (t-tw)/N>10000, C(t,tw) reveals aging, corresponding to the so-called α-relaxation regime in glassy systems. This slow dynamics corresponds to the collective dynamics of the boundaries between linguistic categories at the population level. We find, in particular, for a fixed population size, a dependence on tw of the form:
C(t,tw) = C(t1−μ − tw1−μ) , (1)
with μ = 0.75 (see Figure 4(b)). Note that the same type of dependence on t and tw is also found in correlation functions of real glasses, making quantitative the analogy of the CG dynamics with the dynamics of real out-of-equilibrium physical systems that exhibit sub-aging behavior.
Figure 4 also reveals that the dependence of the length of the plateau on the population size is of the order of Nβ with β ~ 4.5. This suggests that the attractor of the dynamics, where a single linguistic category spreads over the whole interval, is practically never reached for large enough population sizes, and metastable states with a limited number of linguistic categories last for a practically infinite time.
Figure 4. (a) The autocorrelation C(t/N, tw/N ) for tw/N = 106, 107 and N = 500, 800. The inset shows the collapse of the β-relaxation regime. In this regime, there is a very weak violation of the dependence of C(t/N, tw/N ) on t − tw (time-translation invariance). (b) The collapse of the autocorrelation functions shown in (a) in the α-relaxation regime indicating sub-aging (μ=0.75). This result shows that the relaxation is strongly dependent on the size of the population (∼ Nβ with β ~ 4.5).